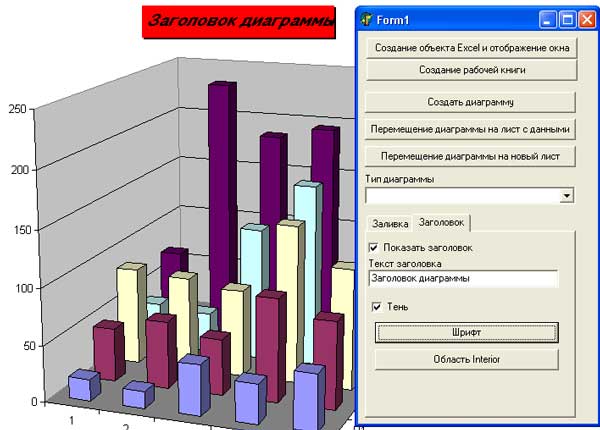
На этом шаге мы рассмотрим настройку заголовка диаграммы.
Чтение и изменение свойств заголовка диаграммы производятся с помощью объекта ChartTitle, но для доступа к этому объекту необходимо активизировать заголовок, иначе объект ChartTitle и сам заголовок будут недоступны. Это делается путем установки свойства Chart.HasTitle в значение True (для скрытия заголовка этому свойству присваивается значение False). Получив доступ к заголовку, мы можем изменить и его содержание и параметры области, в которой он размещен. Для этого используем свойства Font (шрифт), Border (линия границы), Interior и Fill (свойства заливки), Shadow (наличие тени), Left и Тор (координаты расположения заголовка) объекта ChartTitle.
Приведем полный текст приложения.
unit Unit1;

interface

uses
  Windows, Messages, SysUtils, Variants, Classes, Graphics, Controls, Forms,
  Dialogs, StdCtrls, ComObj, Spin, ExtDlgs, ExtCtrls, ComCtrls;

type
  TForm1 = class(TForm)
    Button1: TButton;
    Button2: TButton;
    Button3: TButton;
    Button4: TButton;
    Button5: TButton;
    ComboBox1: TComboBox;
    Label1: TLabel;
    PageControl1: TPageControl;
    TabSheet1: TTabSheet;
    Label4: TLabel;
    Label5: TLabel;
    Label6: TLabel;
    Label7: TLabel;
    Label8: TLabel;
    Button6: TButton;
    SpinEdit1: TSpinEdit;
    ScrollBar1: TScrollBar;
    ComboBox2: TComboBox;
    Button7: TButton;
    ComboBox3: TComboBox;
    Label2: TLabel;
    TabSheet2: TTabSheet;
    CheckBox1: TCheckBox;
    Label3: TLabel;
    Edit1: TEdit;
    CheckBox2: TCheckBox;
    Button8: TButton;
    Button9: TButton;
    FontDialog1: TFontDialog;
    ColorDialog1: TColorDialog;
    procedure Button1Click(Sender: TObject);
    procedure Button2Click(Sender: TObject);
    procedure Button3Click(Sender: TObject);
    procedure Button4Click(Sender: TObject);
    procedure Button5Click(Sender: TObject);
    procedure ComboBox1Change(Sender: TObject);
    procedure Button6Click(Sender: TObject);
    procedure Button7Click(Sender: TObject);
    procedure CheckBox1Click(Sender: TObject);
    procedure CheckBox2Click(Sender: TObject);
    procedure Button8Click(Sender: TObject);
    procedure Button9Click(Sender: TObject);
  private
    { Private declarations }
  public
    { Public declarations }
  end;

var
  Form1: TForm1;

implementation
var
  E:variant;
  Chart:Variant;
const
  xlLocationAsNewSheet=1; //Размещение диаграммы на новом листе
  xlLocationAsObject=2; //Размещение диаграммы на листе с данными

{$R *.dfm}
//Функция задания шрифта заголовка диаграммы
Function  SetFontRange(c:variant;font:Tfont):boolean;
begin
  SetFontRange:=true;
  try
  c.Font.Name:=font.Name;
  if fsBold in font.Style  then
      c.Font.Bold:=True // Жирный
  else c.Font.Bold:=False; // Тонкий
  if fsItalic in font.Style then
      c.Font.Italic:=True // Наклонный
  else c.Font.Italic:=False;  // Наклонный
  c.Font.Size:=font.Size;  // Размер
  if fsStrikeOut in font.Style then
      c.Font.Strikethrough:=True // Перечеркнутый
  else c.Font.Strikethrough:=False;  // Перечеркнутый
  //Подчеркивание
  if fsUnderline in font.Style then c.Font.Underline:=2 //xlUnderlineStyleSingle
  else c.Font.Underline:=-4142; //xlUnderlineStyleNone
  c.Font.Color:=font.Color; // Цвет
  except
  SetFontRange:=false;
  end;
end;

procedure TForm1.Button1Click(Sender: TObject);
//Создание объекта Excel и отображение окна
begin
  E:=CreateOleObject('Excel.Application');
  E.Visible:=True;
end;

procedure TForm1.Button2Click(Sender: TObject);
//Создание рабочей книги
begin
  E.WorkBooks.Add;
end;

procedure TForm1.Button3Click(Sender: TObject);
//Добавление диаграммы и получение ссылки на нее
var
  i:Integer;
const xl3DColumn=-4100;
      xlColumns=2;
begin
  Randomize;
  for i:=1 to 5 do
  begin
    E.ActiveSheet.Cells(1,i):=i*(1+Random(50));
    E.ActiveSheet.Cells(2,i):=i*(1+Random(50));
    E.ActiveSheet.Cells(3,i):=i*(1+Random(50));
    E.ActiveSheet.Cells(4,i):=i*(1+Random(50));
    E.ActiveSheet.Cells(5,i):=i*(1+Random(50));
  end;
  Chart:=E.Charts.Add;
  Chart.ChartType:=xl3DColumn;
  Chart.SetSourceData(Source:=E.ActiveWorkbook.Sheets.Item['Лист1'].Range['A1:F5'],
     PlotBy:=xlColumns);
end;

procedure TForm1.Button4Click(Sender: TObject);
//Перемещение диаграммы на лист с данными
begin
  Chart.Location(Where:=xlLocationAsObject, Name:='Лист1');
  Chart:=E.ActiveChart;
end;

procedure TForm1.Button5Click(Sender: TObject);
//Перемещение диаграммы на новый лист
begin
  Chart.Location(Where:=xlLocationAsNewSheet);
  Chart:=E.ActiveChart;
end;

procedure TForm1.ComboBox1Change(Sender: TObject);
//Изменение типа диаграммы
begin
  Chart.ChartType:=ComboBox1.ItemIndex+51;
end;

procedure TForm1.Button6Click(Sender: TObject);
//Задание цвета заливки
begin
   Chart.ChartArea.Fill.ForeColor.SchemeColor:=
      SpinEdit1.Value;
end;

procedure TForm1.Button7Click(Sender: TObject);
//Одноцветная градиентная заливка
begin
 Chart.ChartArea.Fill.OneColorGradient(ComboBox2.ItemIndex+1,
     ComboBox3.ItemIndex+1, ScrollBar1.Position*0.01);
end;

procedure TForm1.CheckBox1Click(Sender: TObject);
//Показ/скрытие заголовка
begin
  if CheckBox1.State=cbUnChecked then
       Chart.HasTitle:=False
  else
    begin
       Chart.HasTitle:=True;
       Chart.ChartTitle.Text:=Edit1.Text;
    end;
end;

procedure TForm1.CheckBox2Click(Sender: TObject);
//Включение выключение тени
begin
  Chart.ChartTitle.Shadow:=CheckBox2.Checked;
end;

procedure TForm1.Button8Click(Sender: TObject);
//Задание шрифта
begin
   if FontDialog1.Execute then
     SetFontRange(Chart.ChartTitle,FontDialog1.Font);
end;

procedure TForm1.Button9Click(Sender: TObject);
//Задание цвета области Interior
begin
  if ColorDialog1.Execute then
     Chart.ChartTitle.Interior.Color:=ColorDialog1.Color
end;

end.
Результат работы приложения изображен на рисунке 1.

Рис.1. Настройка заголовка диаграммы
На следующем шаге мы рассмотрим область построения диаграммы.
